
How to plot quadratic function with different number of points in MATLAB?
Plot quadratic function \(x^2\) in MATLAB
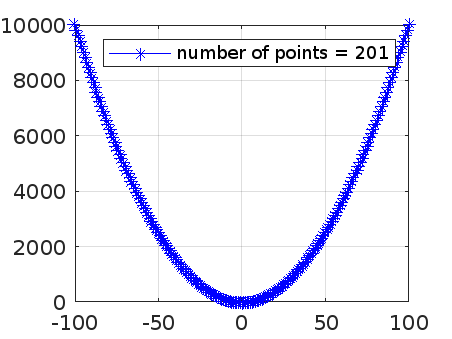
This is a very basic task to plot quadratic function \(x^2\) in MATLAB. But there are some additional things that need to understand. First of all, one function was created for different values of \(x\) that shows the behaviour of the graph and smoothness by increasing points.
Few other operations:
- Plot same function in MATLAB using for loop
- Display legend for each graph in for loop separately
- Saving Images as PNG in folder
Built-in commands Used:
- num2str -- used to convert numeric value to structure
- sprintf -- used to formatted data as a string, which the user can store or further manipulate or display as appropriate.
- saveas -- used to save the graphs generated in folder
n = [2 5 10 100 1e3];
for i = 1:numel(n)
    x = -n(i):n(i);
    y = x.^2;
    txt = ['number of points = ',num2str(2*n(i)+1)];
    plot(x,y,'b-*','DisplayName',txt)
    grid on;
    legend show
    saveas(gcf,sprintf('x^2_%d.png',n(i)));
end
OUTPUT


0 Comments